UHREIT 1Q 2026: Distributable Income +10.0% To US$6.9M, NPI +12.7% Outpace Revenue +8.7% — Self-Storage Occupancy Bottoms At 89.2%, 2026 Lease Rollover Compressed To 2.0%, WAIR Falls Fourth Consecutive Quarter To 4.91%
United Hampshire US REIT released its 1Q 2026 business update on 13 May 2026
United Hampshire US REIT released its 1Q 2026 business update on 13 May 2026 — a print that on a single read scans as a clean acquisition-driven growth quarter (revenue +8.7%, NPI +12.7%, distributable income +10.0% YoY), and on a closer read is a quietly compounding story across three independent axes: operating leverage is now expanding NPI faster than revenue, the self-storage sleeve has bottomed, and the leasing team has compressed the 2026 expiry stack from 2.9% at FY2025 close to 2.0% in a single quarter. Gross revenue rose to US$19.7M, net property income to US$13.2M, and distributable income to US$6.9M for the three months ended 31 March 2026. Grocery & Necessity portfolio occupancy held at 97.7%; weighted average lease expiry lengthened from 7.7 years at FY2025 close to 8.0 years; tenant retention held at 90%; and the weighted average interest rate dropped for the fourth consecutive period to 4.91%. With no refinancing requirements until February 2028, the FY2026 distribution arithmetic is now substantially de-risked at the cost-of-debt line.
The lede is the simplest version of the story. The structural read is more interesting.
Headline Operational and Financial Numbers
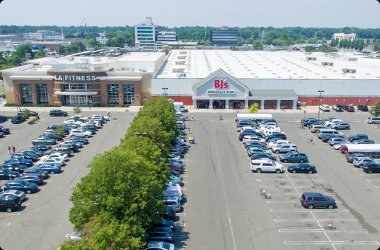
Gross revenue US$19.7M (+8.7% YoY); NPI US$13.2M (+12.7% YoY); distributable income US$6.9M (+10.0% YoY). Grocery & Necessity portfolio occupancy 97.7% (unchanged from 31 December 2025). WALE 8.0 years (FY2025: 7.7 years). Tenant retention 90%. 10 new and renewed leases secured during the quarter totalling 163,725 sq ft. Self-Storage portfolio occupancy 89.2% (31 December 2025: 88.7%) with average quarterly net rental rates "remained high" per the manager. 2026 lease expiry 2.0% of GRI (FY2025 close: 2.9%); 2027 lease expiry 5.2%. Net aggregate leverage 40.3% as at 31 March 2026 (FY2025: 38.6%). Weighted average debt maturity 3.2 years. Weighted average interest rate 4.91% on a trailing 12-month basis (FY2025: 5.01%) — the fourth consecutive period of decline. Interest coverage ratio 2.4x (unchanged). No refinancing requirements until February 2028. Portfolio appraised value US$795.3M (FY2025: US$774.3M; +2.7% inclusive of the Wallingford Fair completion in January 2026). 23 properties: 21 Grocery & Necessity and 2 Self-Storage. NLA approximately 3.7 million sq ft. 58.9% of tenants providing essential services.
1. Operating Leverage Has Quietly Expanded — NPI Grew 1.45x Faster Than Revenue
The most consequential single ratio in this print is not the growth rate of any one line but the relationship between revenue growth and NPI growth. Gross revenue expanded 8.7% YoY; NPI expanded 12.7%. The 4.0 percentage point spread is operating leverage showing up — for every dollar of incremental revenue this quarter, approximately US$1.45 fell through to NPI rather than the proportional US$1.00 a flat-margin portfolio would deliver.
The mechanical sources are three. First, triple-net lease structure: tenants pay insurance, property taxes, and CAM, so revenue grows on rent escalations and acquisitions while opex grows more slowly on the smaller portion UHREIT retains. Second, the August 2025 Dover Marketplace and January 2026 Wallingford Fair acquisitions were both transacted below independent valuation (4.8% and 8.2% respectively) and entered the portfolio at favourable cap rates relative to the cost of debt that funded them. Third, built-in rental escalations on the existing 21-property G&N base continue to compound at the ~2% per annum embedded escalator most of the leases carry.
The implication for forward quarters is that as long as the manager keeps acquiring at discount-to-valuation entries and the triple-net lease structure is preserved, the spread between revenue growth and NPI growth should persist. This is not the textbook flat-margin REIT model where revenue and NPI move in lockstep; this is a slowly margin-expanding portfolio operating in an asset class where the structural supply story (0.3% new strip center supply annually through 2030) supports continued mark-to-market upside on renewals.
2. Self-Storage Occupancy Has Bottomed — First Sequential Uptick After The FY2025 Normalisation
The single most-watched number in the FY2025 result was self-storage occupancy, which had normalised from 93.1% at FY2024 close to 88.7% at FY2025 close — a 4.4 percentage point unwind that the manager characterised as a sector-wide trend rather than asset-specific weakness. 1Q 2026 reports self-storage occupancy at 89.2% — a 0.5 percentage point sequential lift, the first uptick after the FY2025 unwind. The print is small but the direction is what matters: the descent has stopped.
Average quarterly net rental rates "remained high" per the press release. UHREIT's two self-storage assets are operated by Extra Space Storage, one of the largest US self-storage operators, and sit in the New Jersey portion of the New York metropolitan area — a submarket characterised by the manager as carrying a relative undersupply of facilities. The combination of a stabilising occupancy floor with rental rates holding their FY2025 high is the read that supports the manager's "stable" framing of the segment outlook. Carteret (the smaller of the two by valuation but the lower-occupancy asset at FY2025 close) is the swing factor; if the 1Q lift was Carteret-driven, the recovery is more credible than if it was Millburn-driven (which already sat at 91.2%).
3. The 2026 Lease Rollover Compressed From 2.9% To 2.0% In One Quarter
At FY2025 close, the manager disclosed 2026 lease expiry at 2.9% of gross rental income. The 1Q 2026 print reports 2026 lease expiry at 2.0%. The 0.9 percentage point compression is the leasing team executing renewals ahead of schedule against the FY2026 expiry stack — meaning a portion of the 2026 lease book has been pulled forward into committed renewals during the first three months of the year, before the natural expiry dates came due.
10 leases totalling 163,725 sq ft were secured during the quarter, with tenant retention at 90%. The forward implication is that the FY2026 GRI base is more visible at the end of 1Q than it was at the end of FY2025 — what was previously an 8.0-year WALE with a 2.9% near-term rollover is now an 8.0-year WALE with a 2.0% near-term rollover plus the renewed leases already locked into the new WALE. This is the operational equivalent of de-risking cashflow visibility one quarter forward.
4. Cost-Of-Debt Trajectory: Four Consecutive Quarters Of Decline
The weighted average interest rate fell to 4.91% on a trailing 12-month basis in 1Q 2026, down from 5.01% at FY2025 close and 5.17% at FY2024 close. This is the fourth consecutive period of decline. The driver is the November 2025 refinancing that upsized the SOFR term loan facility to US$350M (including a US$100M revolver and a US$50M delayed-draw tranche) and extended weighted average debt maturity from 1.6 years at FY2024 close to 3.4 years at FY2025 close — and now to 3.2 years at 1Q 2026, the natural one-quarter shortening of a fixed maturity stack.
Critically, there are no refinancing requirements until February 2028. That is twenty-two months of forward debt cost visibility from the 1Q 2026 reporting date. The FY2026 distribution arithmetic — at the cost-of-debt line specifically — is now substantially de-risked. Variability in the remaining three quarters comes from operational performance and acquisitions, not from debt refinancing surprises. Interest coverage held at 2.4x.
5. Acquisition Pipeline: Wallingford Fair Is Now Contributing; Aggregate Leverage Stepped Up 170bps
The January 2026 completion of the Wallingford Fair Shopping Center acquisition (UHREIT's maiden entry into Connecticut, US$21.4M purchase price 8.2% below independent valuation, ShopRite-anchored, 100% occupied with 12.5-year WALE) is the single largest portfolio change between FY2025 close and the 1Q 2026 print. The acquisition's contribution is captured in the +8.7% revenue growth alongside Dover Marketplace (PA, acquired August 2025).
The cost was a 170 basis point step-up in net aggregate leverage from 38.6% at FY2025 close to 40.3% at 31 March 2026. This is the highest leverage reading UHREIT has carried in 18 months but remains well inside the 50% MAS regulatory ceiling and meaningfully below the sector average for US-focused S-REITs. Debt headroom to the 45% gearing threshold the manager has historically signalled as its operating ceiling is approximately US$37M against the current portfolio asset base — sufficient for one or two more bolt-on acquisitions in the US$15-25M range that the Dover and Wallingford deals demonstrate is the typical entry size.
The Hudson Valley Plaza DICK'S Sporting Goods grand opening in March 2026 (DICK'S is a top-10 UHREIT tenant by GRI per the FY2025 disclosure) is the most concrete operational milestone of the quarter beyond the financial print. Hudson Valley Plaza's 94.9% FY2025 occupancy carried implicit upside from this commencement; the 1Q print does not break out individual asset occupancy but the G&N portfolio's 97.7% reading is consistent with Hudson Valley lifting toward portfolio-typical levels.
6. Macro Backdrop: Strip Center Supply Remains Muted; Fed Held In April Citing Iran-Driven Inflation
The press release outlines a macro backdrop that on balance supports the grocery-anchored thesis. Strip center new supply growth is expected to remain at approximately 0.3% annually over the next four years per Green Street's March 2026 update — a number that is materially below the ~2% pre-pandemic supply growth rate and is the structural underpinning of the rent reversion case across the sector. Strip centers outperformed other retail formats in 4Q 2025 with foot traffic +3.0% YoY, exceeding pre-pandemic levels by 6.0%.
The Federal Reserve held its benchmark rate at 3.5%-3.75% at the April 2026 meeting citing elevated inflation, with the manager explicitly attributing the inflationary headwind to "the lingering war in Iran" — a notable framing choice that signals the manager's view of the 2026 rate path is conditioned on geopolitical resolution rather than purely on US domestic macro data. The Fed pause is broadly neutral for UHREIT given the four-consecutive-quarter WAIR decline already locked in via the November 2025 refinancing; further cuts would compound, but the absence of cuts does not threaten the FY2026 distribution math.
March 2026 US retail sales grew 1.7% MoM (heavily gasoline-driven at +15.5%) and 4% YoY. Labour market resilient with April 2026 unemployment at 4.3%. IMF forecast 2026 US GDP at 2.3%, among the highest in advanced economies. The consumer backdrop supports the grocery-anchored tenant base's same-store sales trajectory that drove the FY2025 reversion case.
Key Takeaway
UHREIT 1Q 2026 is a quietly compounding print. Three independent positive deltas — operating leverage expanding the NPI growth rate above revenue growth, self-storage occupancy bottoming with rental rates intact, and the 2026 lease rollover compressing by 90bps in a single quarter — combine with two easing capital headwinds (WAIR at 4.91% / no refinancing until February 2028) to deliver a +10.0% YoY distributable income print without any single dramatic catalyst. The 170bps leverage step-up to 40.3% from the Wallingford completion is the offsetting watchpoint, but at 40.3% the gearing remains inside the manager's operating range with approximately US$37M of headroom for further bolt-on acquisitions. The DICK'S Sporting Goods Hudson Valley commencement in March 2026 is the most concrete operational milestone of the quarter. Forward attention now belongs on (a) whether the self-storage 89.2% reading extends to a second consecutive sequential gain in 2Q, (b) whether the leasing team can keep compressing the rollover stack ahead of natural expiry, and (c) whether the manager elects to deploy the remaining gearing headroom into a third acquisition before the FY2026 mid-year mark.